Circular Economy & Systems Mapping
Service > Mapping clarity in complexity

Our world is a dynamic, complex place. Gaining oversight and insight into a situation is often the first step towards a good solution. System maps do this by visually mapping relations of the 'system' that we're a part of. While often useful, system mapping is practically required when trying to work on circular economy, supply chain optimization, and other energy and material flow related challenges. They allow you to grasp complicated industries, policies, or urban developments at a glance.
System maps, when developed in co-creation, can also deliver significant advantages for working group decision making processes, stakeholder involvement and higher management decision making.
Except uses a wide variety of methods and tools to develop the right system map for the task at hand. Some examples:
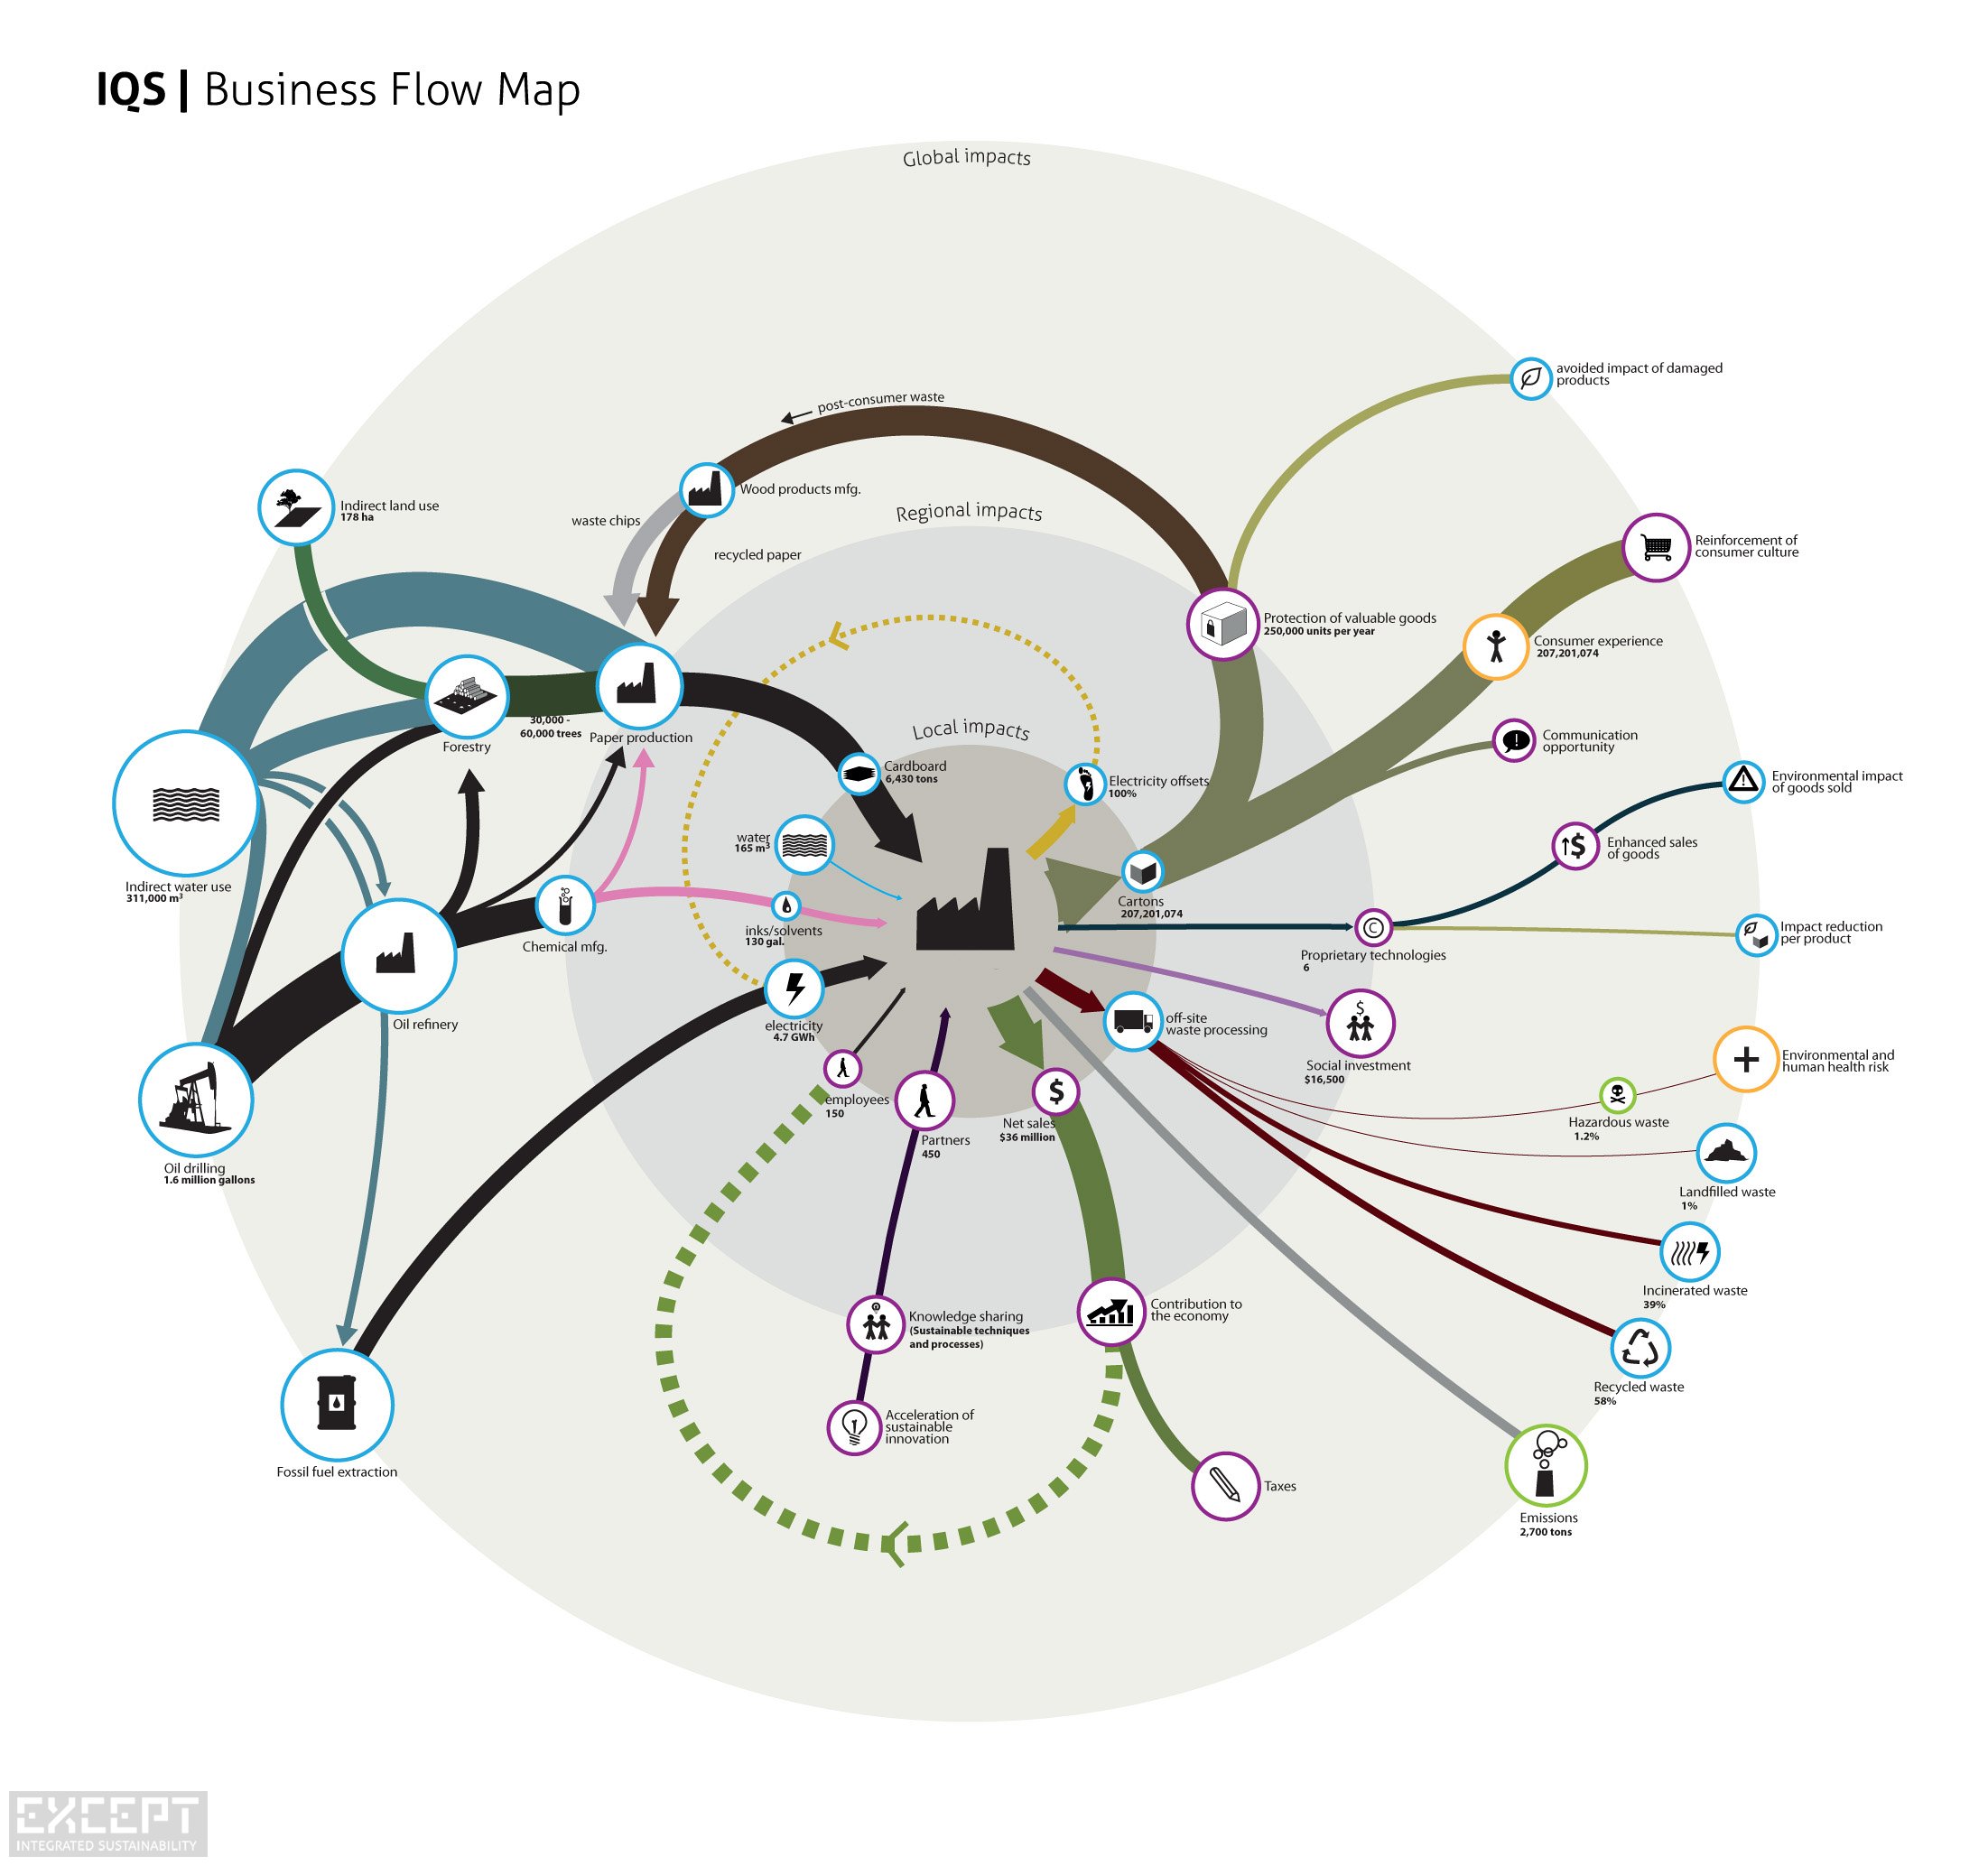
 For business
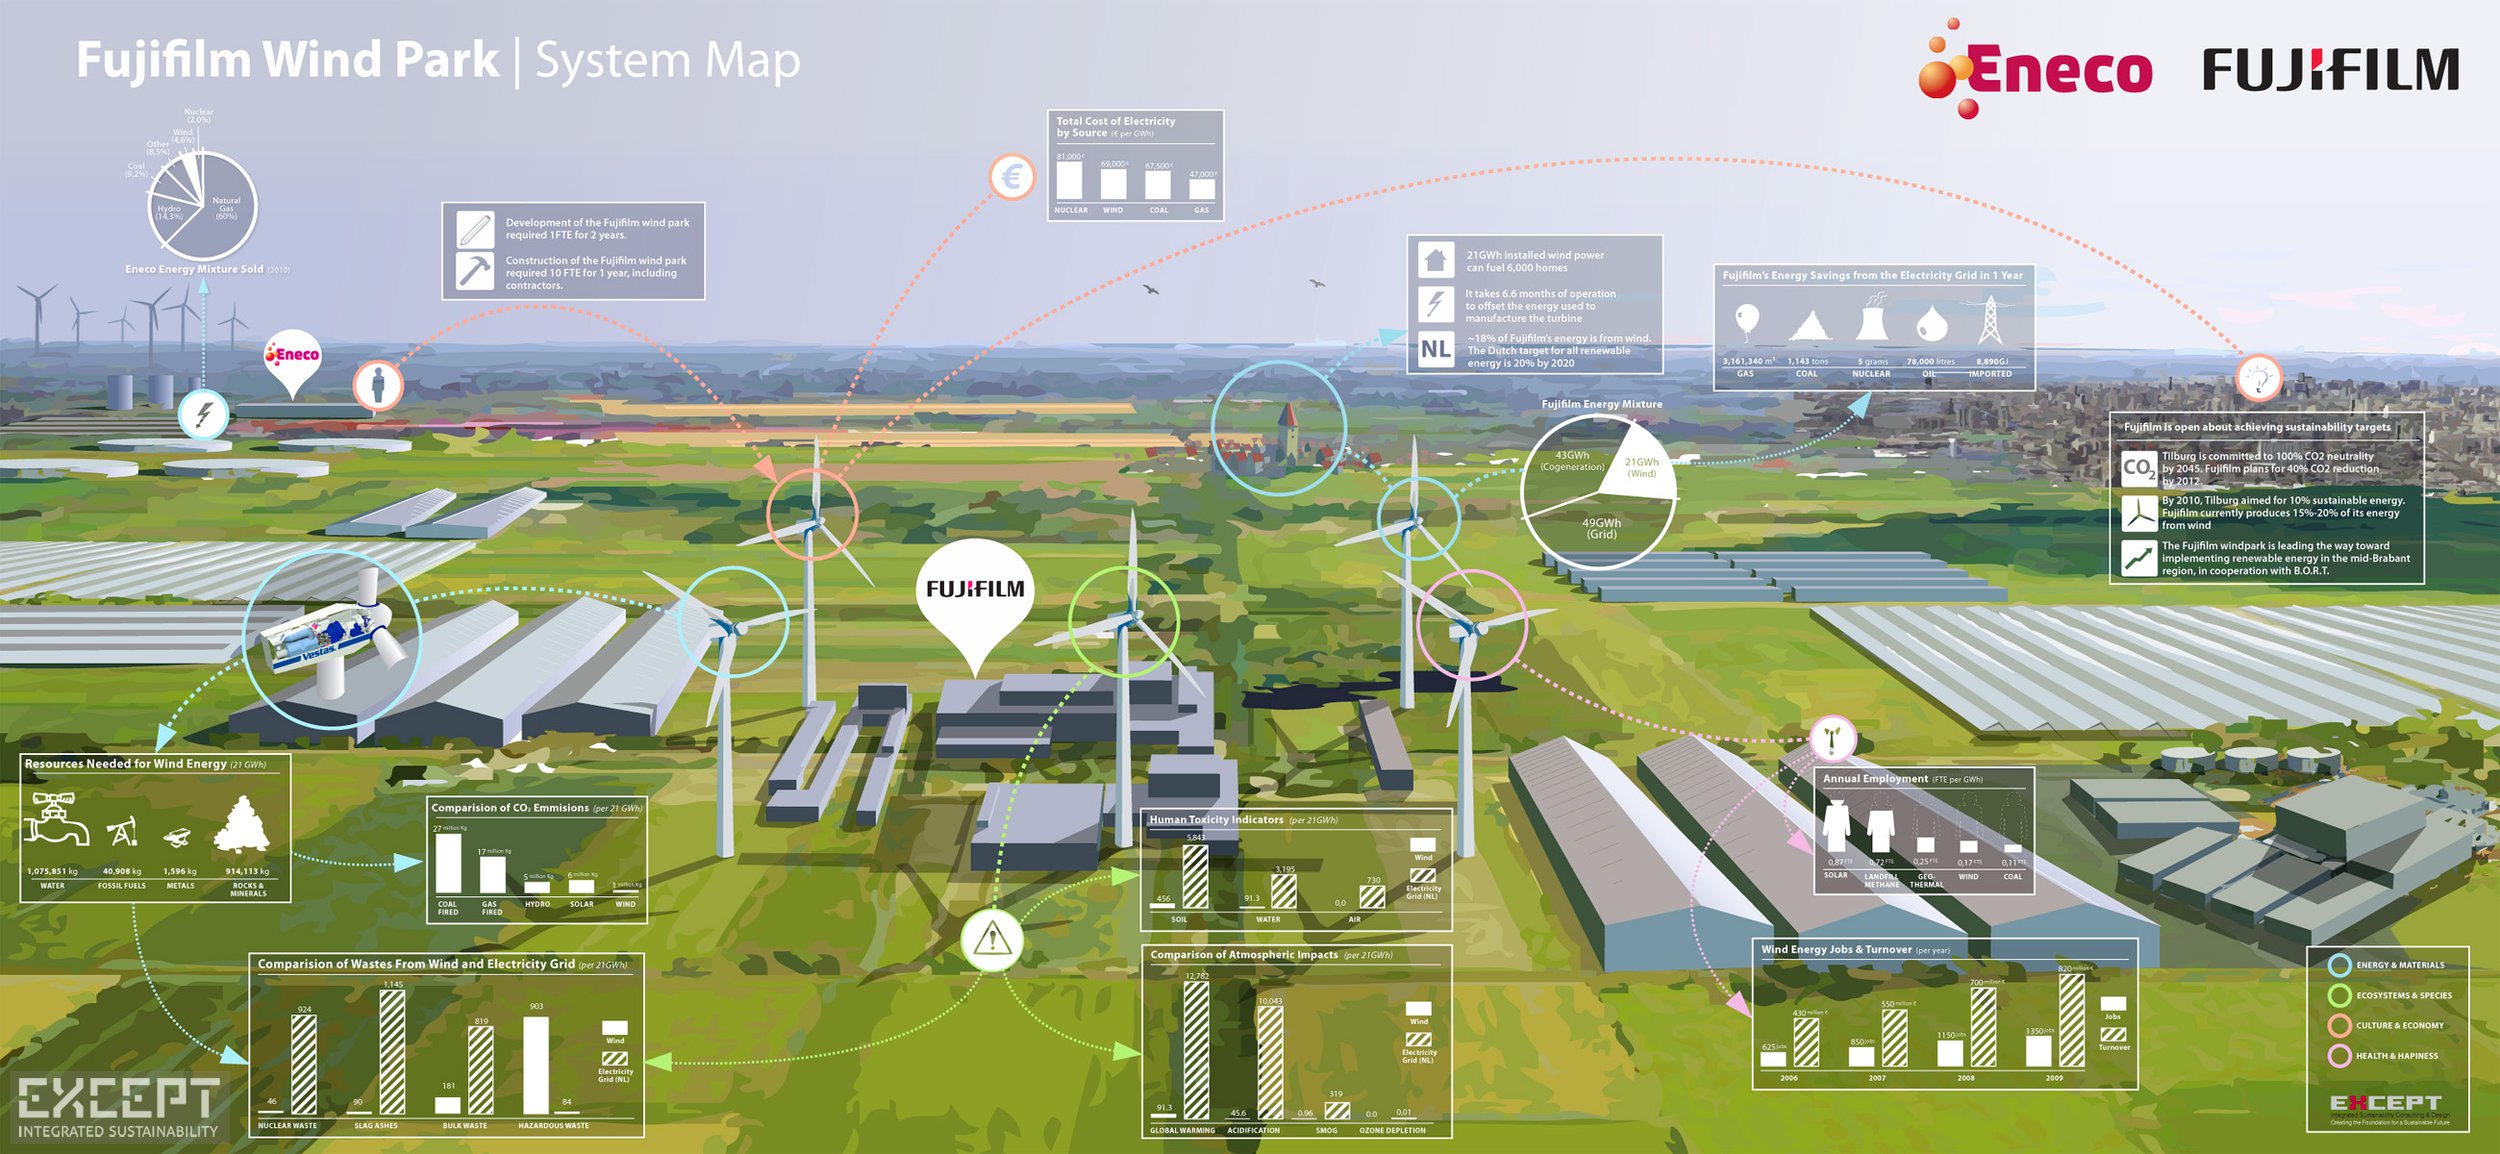
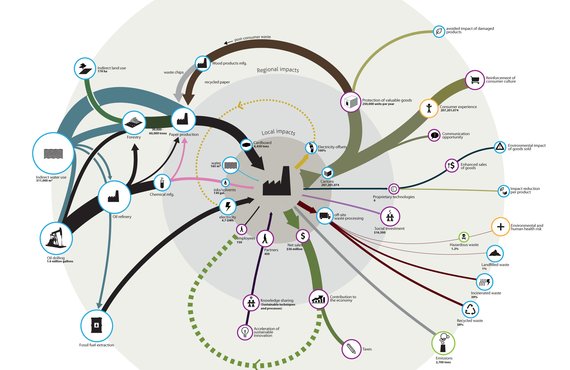
System maps allow you to see where the largest costs and impacts of your products and services are made. It gives you a strategic oversight of your entire operations at a glance, allows you to include stakeholders and make long term improvement plans.
System maps allow you to find key strategic leverage, by yourself or with a group. Rather than wading through thick reports, one single image can provide the insight you need.
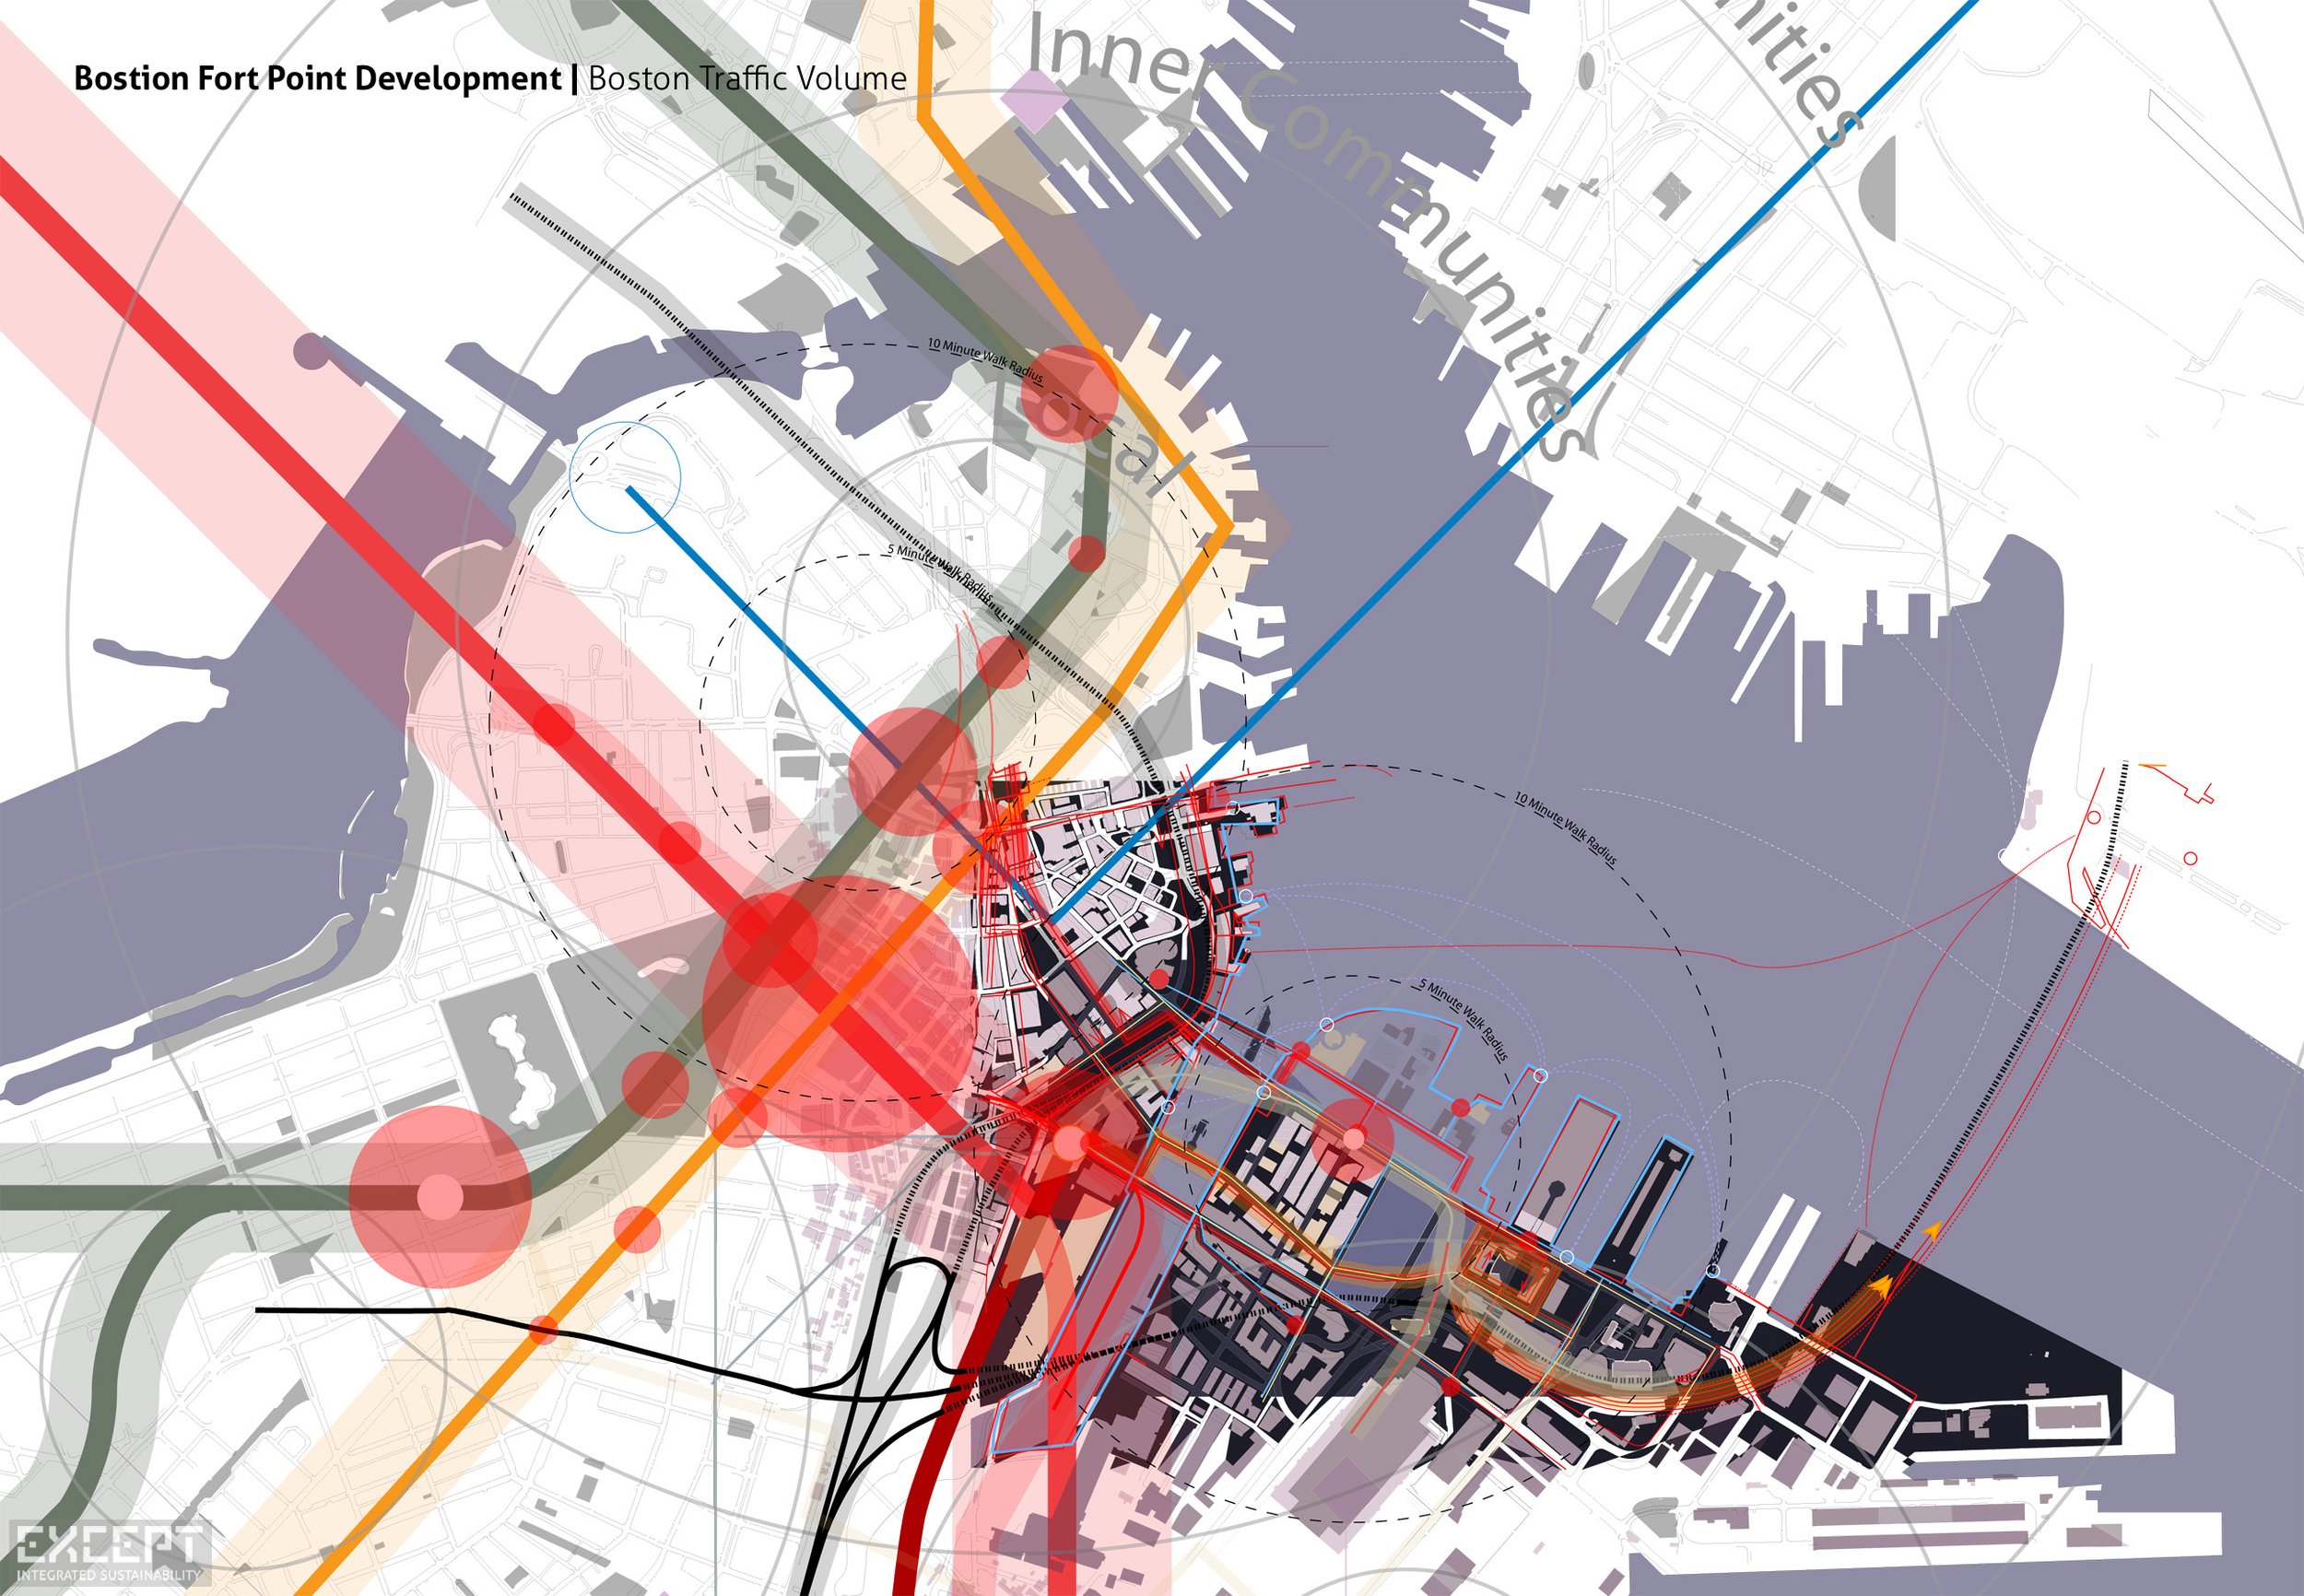
For cities & communities
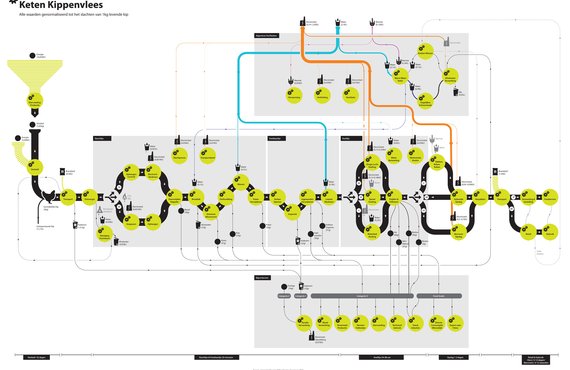
System maps show you how energy, material, people and financial streams flow through your city. They allow strategic insight into where the most effective measures can be taken to improve local conditions, create circularity, save money and involve the community.
System maps also create an opportunity to collaboratively work with stakeholders in the community, and as a support for group decisionmaking.
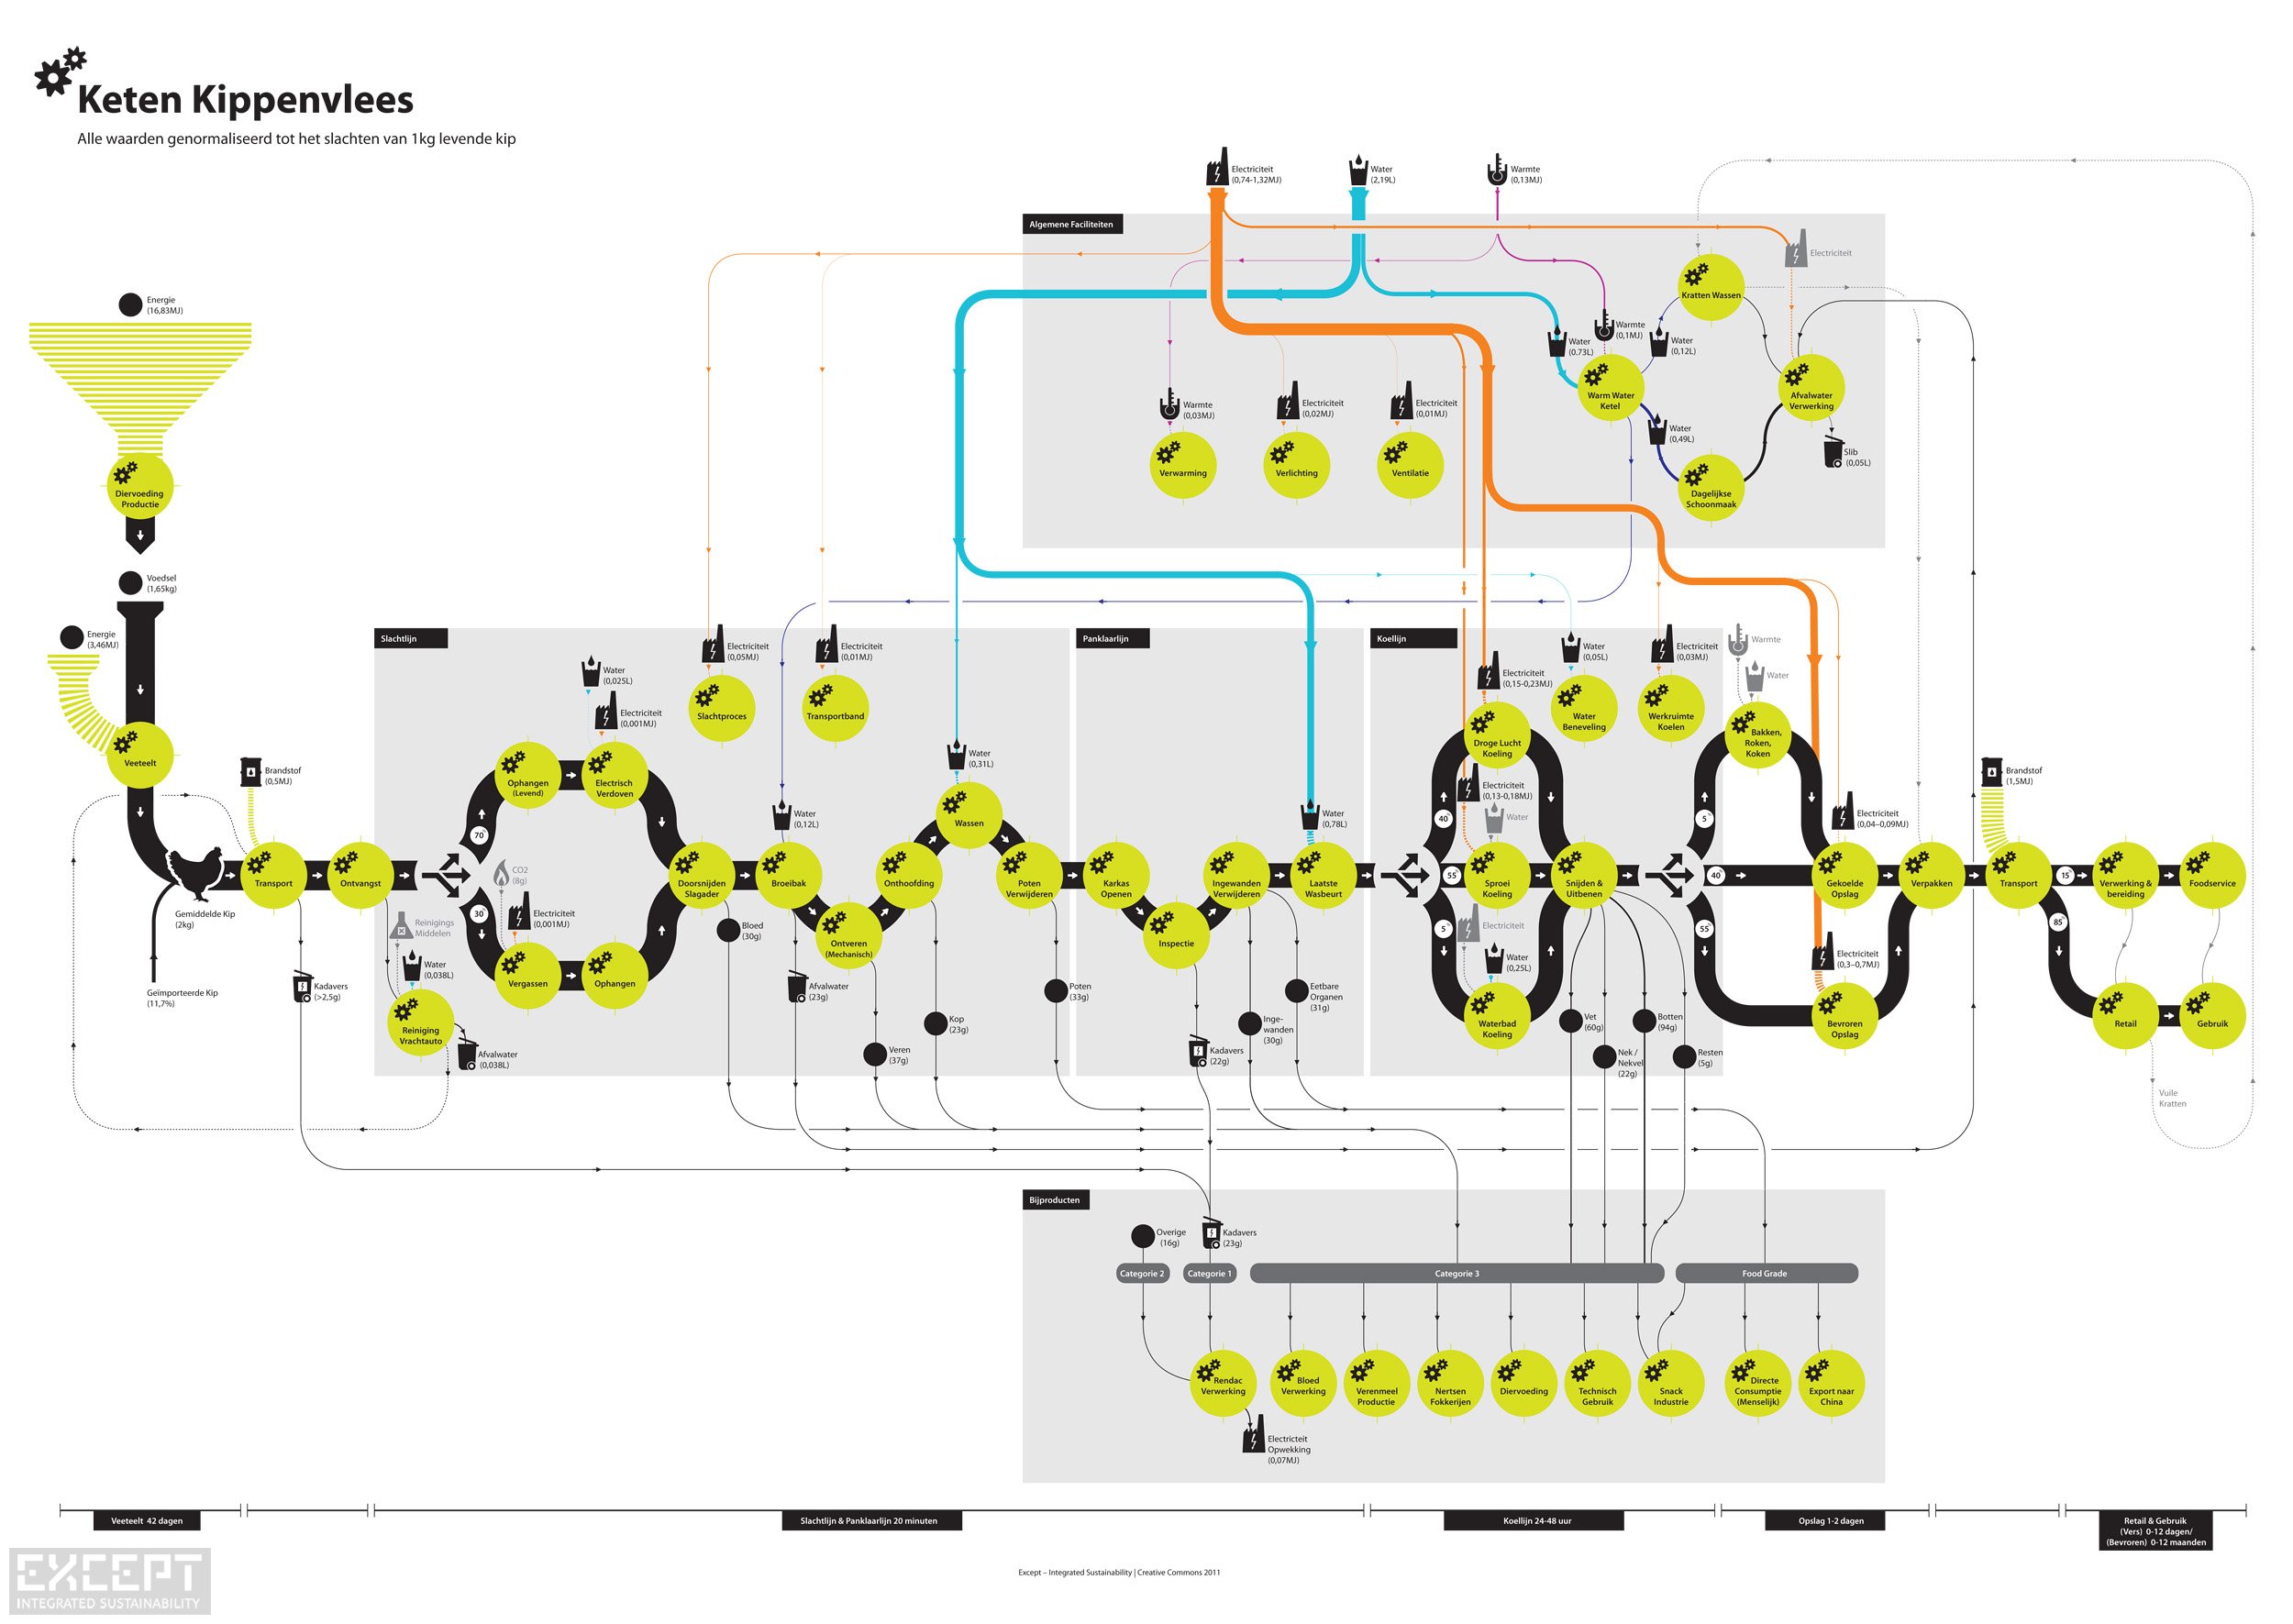
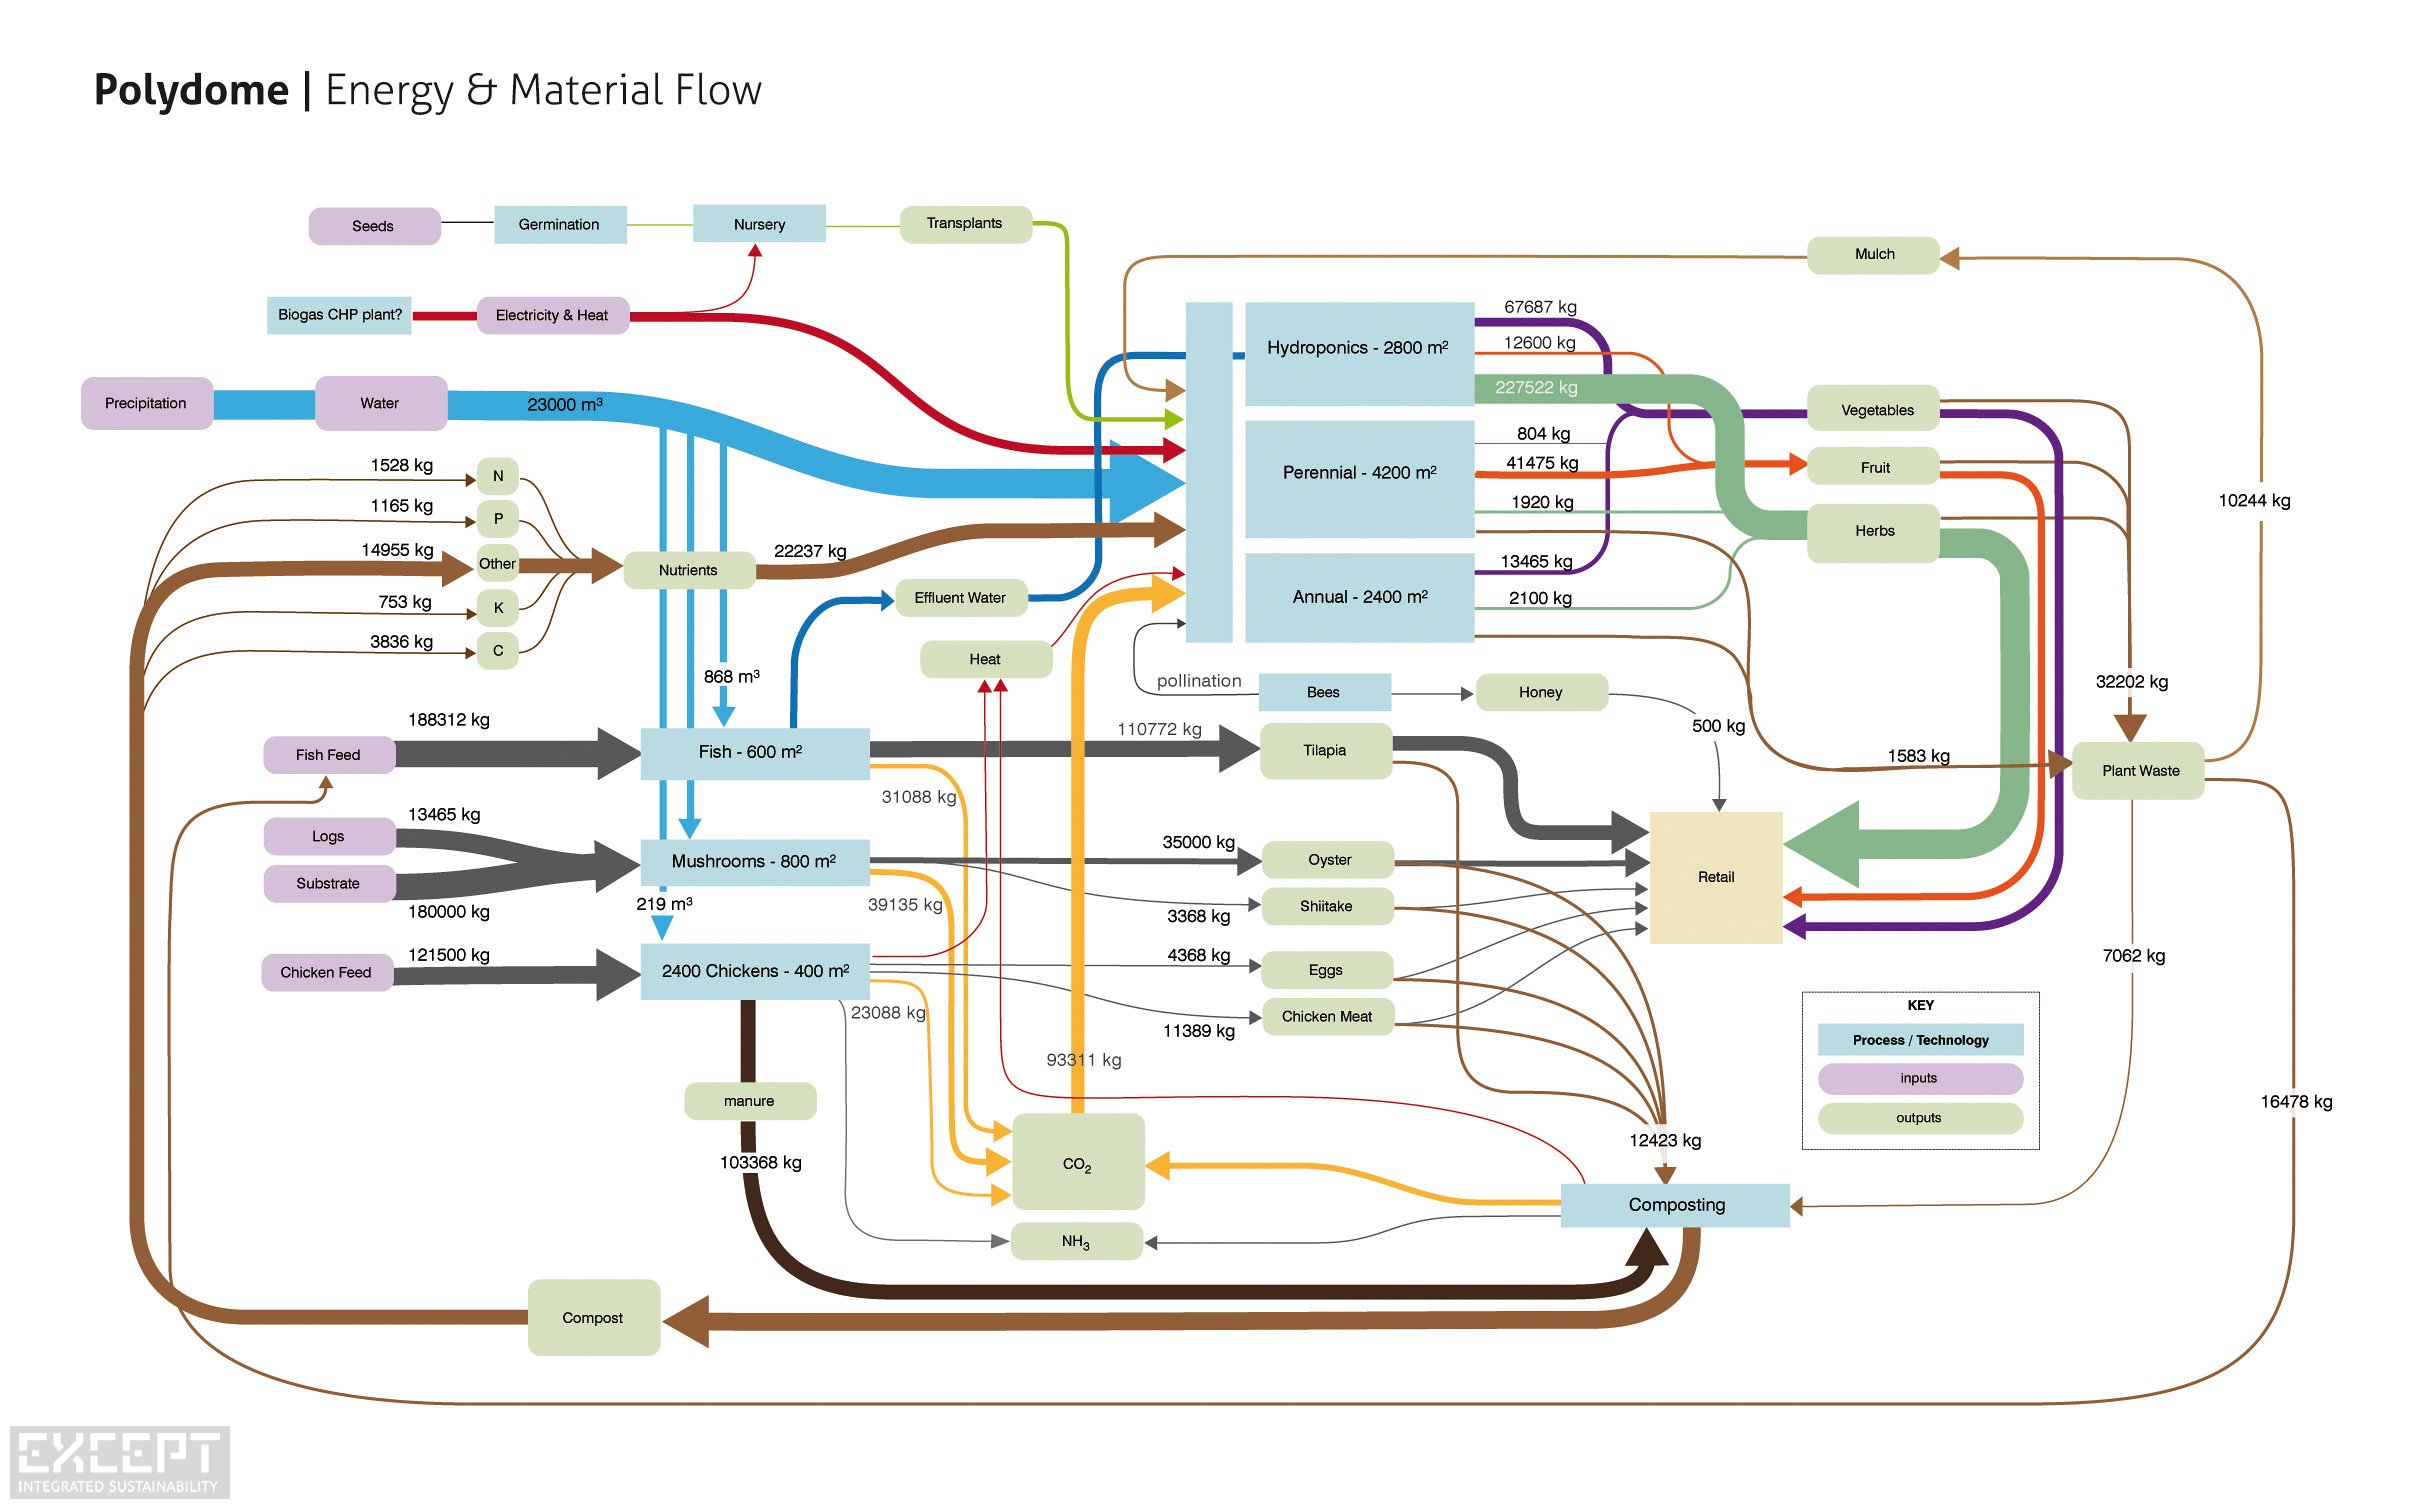
For industry
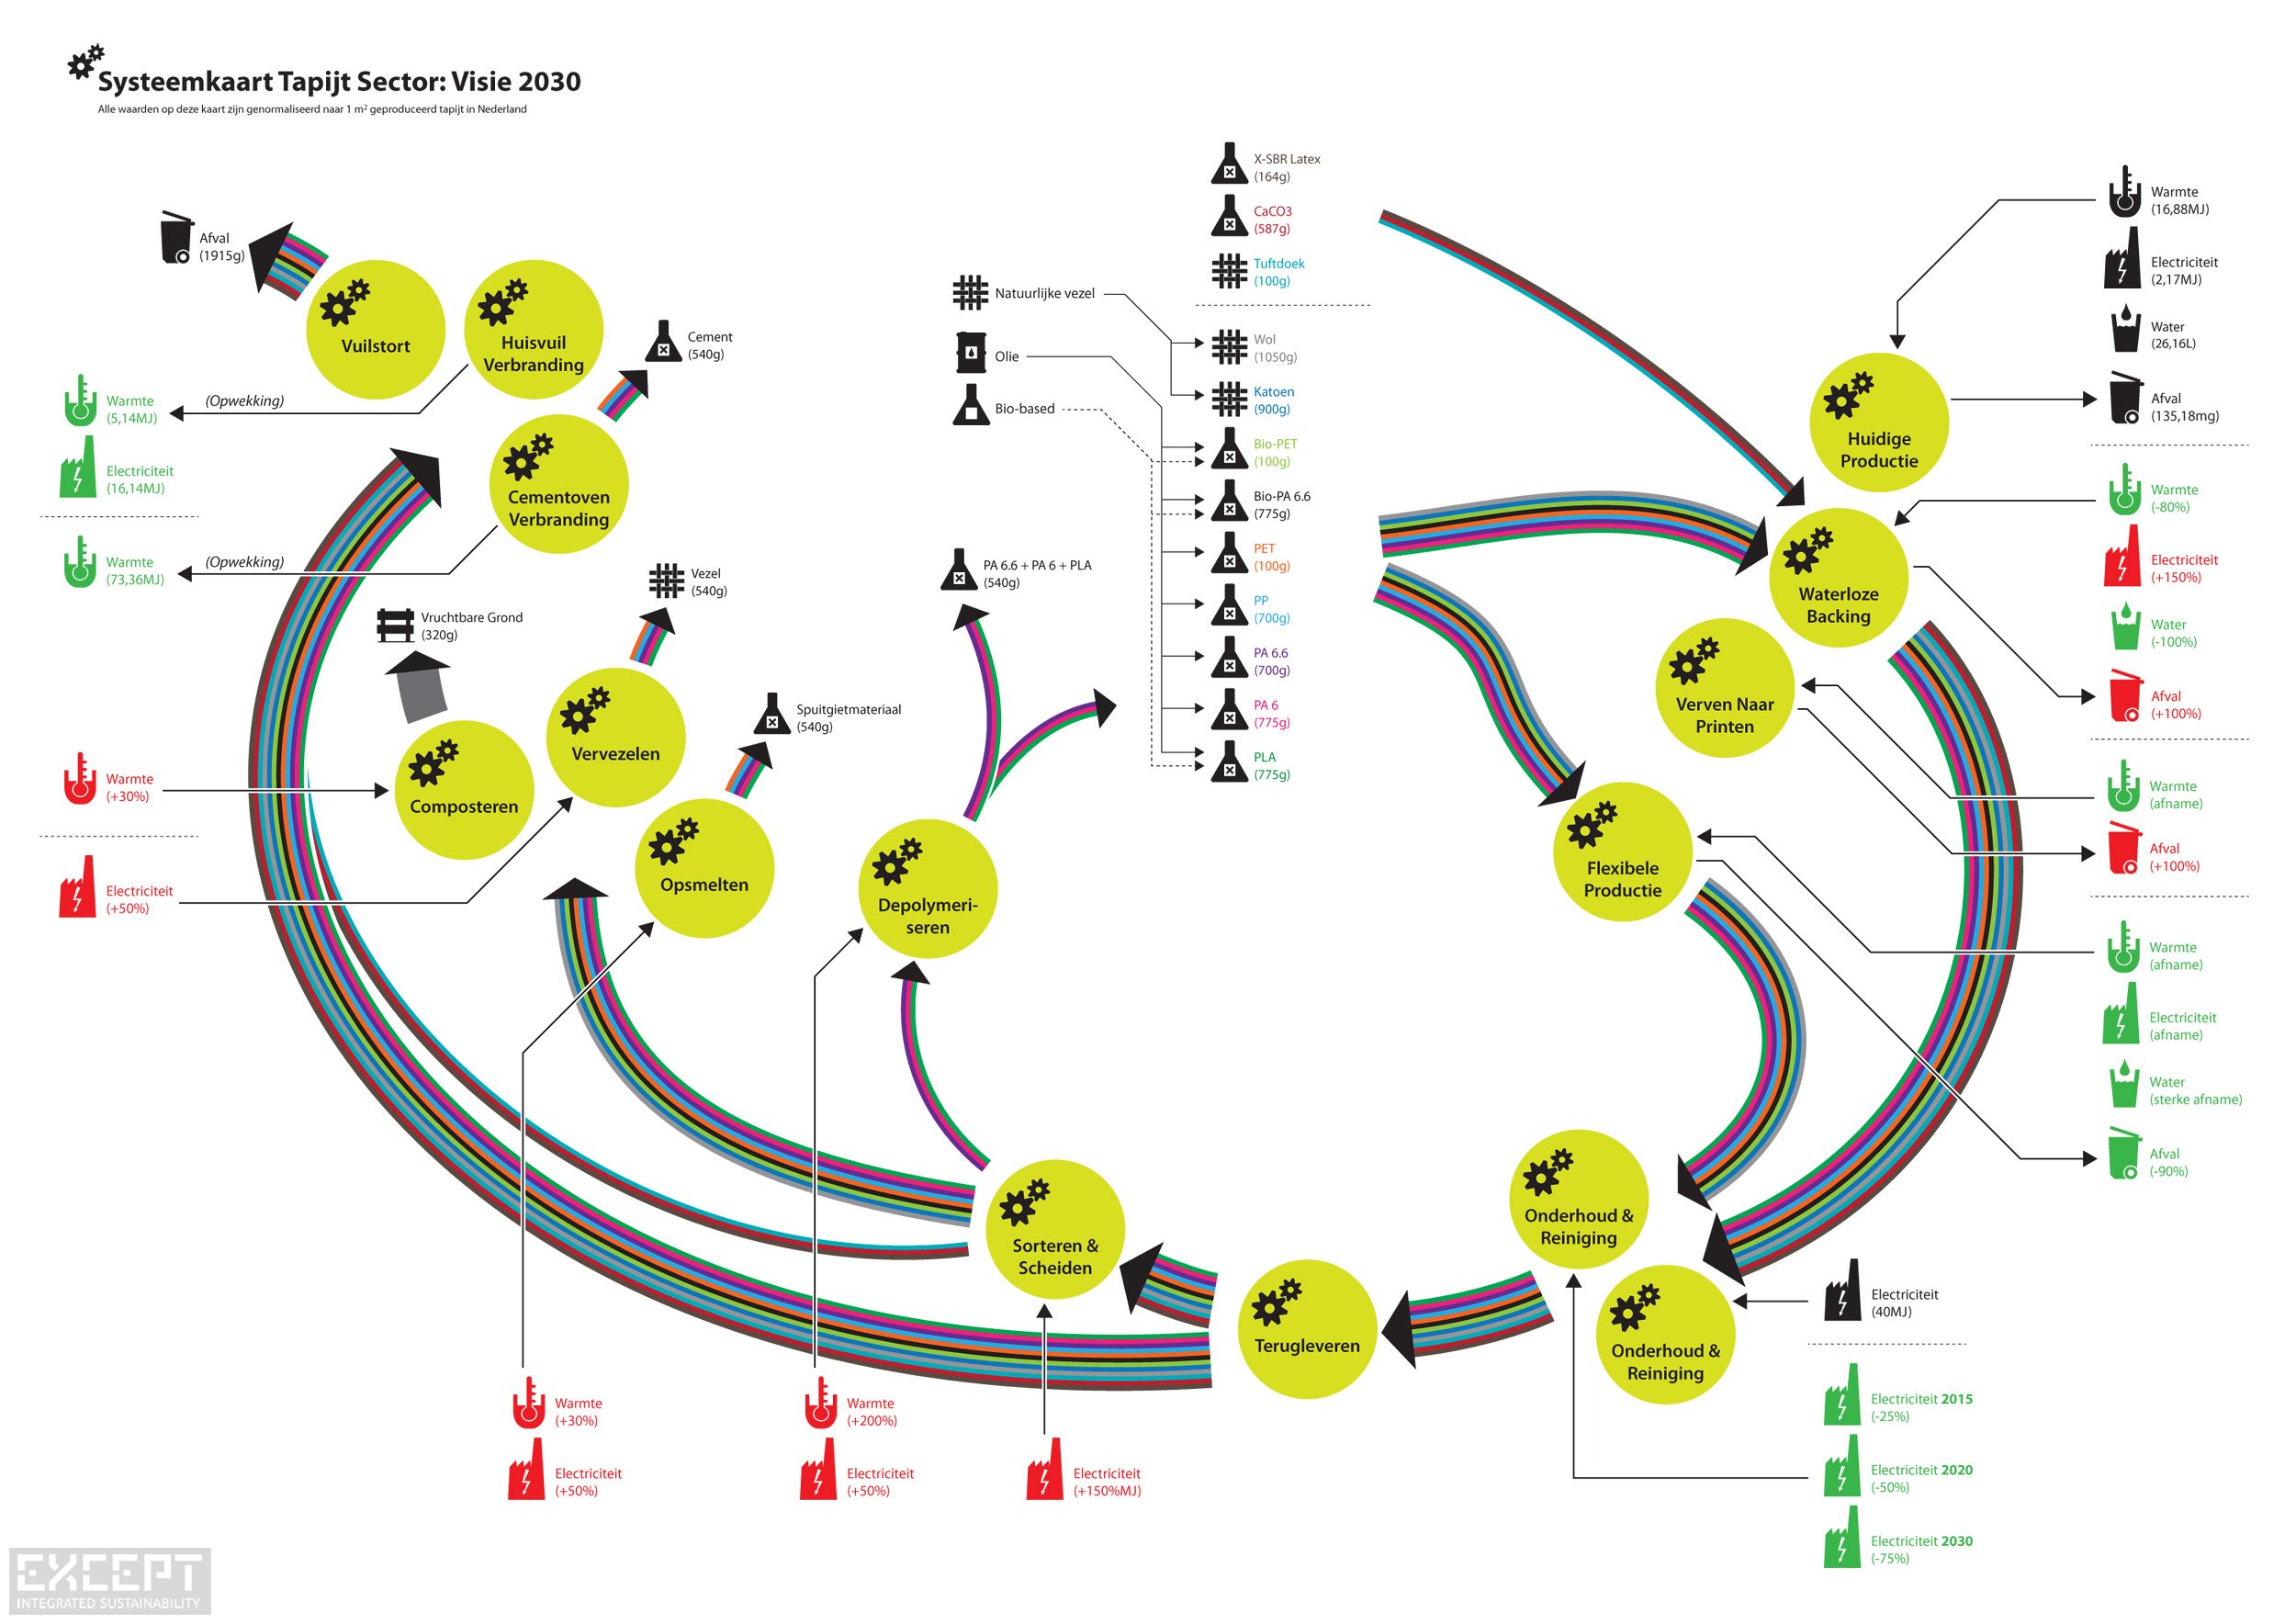
System maps allow the mapping of the effects of your industry within society, including the positive ones. They form the basis for smart strategies such as industrial symbiosis, cogeneration and supply chain optimization.
With a system map, you can also work with a team to further the understanding of your industry and find key leverage points for improvement.
For policy
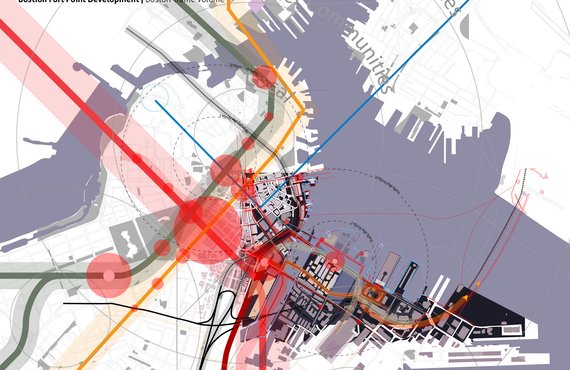
Mapping the effects of policy and societal dynamics brings deep understanding of the effectivity of policy, and creates insight into where policy could have the highest priority.
When using system maps in joint stakeholder processes, an overview is made that is shared by all participants, allowing easier communication and faster decisionmaking trajectories.
Custom map development
System maps can be made in a right way... and in a wrong way. A good system map brings clarity, understanding and oversight. A bad system map may look funky, but may add little to decision making and offer few directions to move forward. Each situation warrants its own approach to system mapping. By having experienced scientists, analysts and visual designers work together, we've been making insightful and powerful system maps for a decade.
We work with you in a step by step process to determine what map, scope, and level of complexity is right for you, and if you’d like to do this in a co-creation or a hands-off process.
Want to know how system maps can shine a light on your situation? We're happy to talk to you about it, send us an email or give us a call.
Examples
The Dandelion Project
Dandelion is a next generation (web 3.0) software application that binds scientific, social and economic data from all over the world in an immersive visual environment. It's like google on steroids, allowing you to visually fly through three dimensional realms of information, putting it at your fingertips and making it useful.
It enables a boost in productivity for knowledge management, research and social connectivity for anyone involved with research and development.
Dandelion is developed in partnership with the Dutch government and Storrm CS consultants.

DNV Waste Water Chains
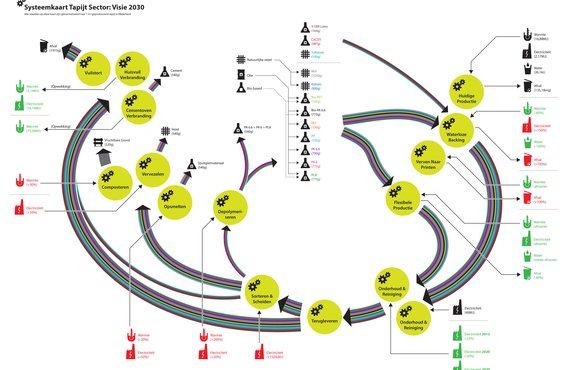
This project is a visual exploration of the Dutch waste water sector in 2030. It takes a closer look at the role of waste water processing facilities for the provision of clean water, renewable energy, and valuable material inputs for society of the future.
The vision for 2030 concerns the role of waste water management in four major parts of society: the built environment, agriculture, industry, and natural lands.

Contact
Tom Bosschaert
Director
 [javascript protected email address]
 +31 10 7370215